Agent observability for every production team.
LumiqTrace traces every AI agent decision, tool call, and handoff in production. Engineering teams debug faster, cut cost, and ship with confidence.
Free tier available·No credit card required·Setup under 5 minutes
Works with the AI stack your team already runs
Understand your agents.
Then act on them.
LumiqPilot reads your live trace data, metrics, and config to answer questions, then acts on them in the same conversation.
Deep data analysis
Ask "why did costs spike?" Pilot reads your live traces, surfaces the exact session, model, and deployment that caused it.
Instant action from insight
Continue the same conversation: create an alert, switch models, roll back a prompt, all without leaving Pilot.
Proactive auto-remediation
Pilot surfaces anomalies and cost opportunities before you ask. Define rules to auto-remediate incidents on Scale.
End-to-End Platform
One platform.
Every layer of your agent stack.
From the first planning step to the last tool call, every agent decision in one place. Two lines to instrument, nothing else to configure.
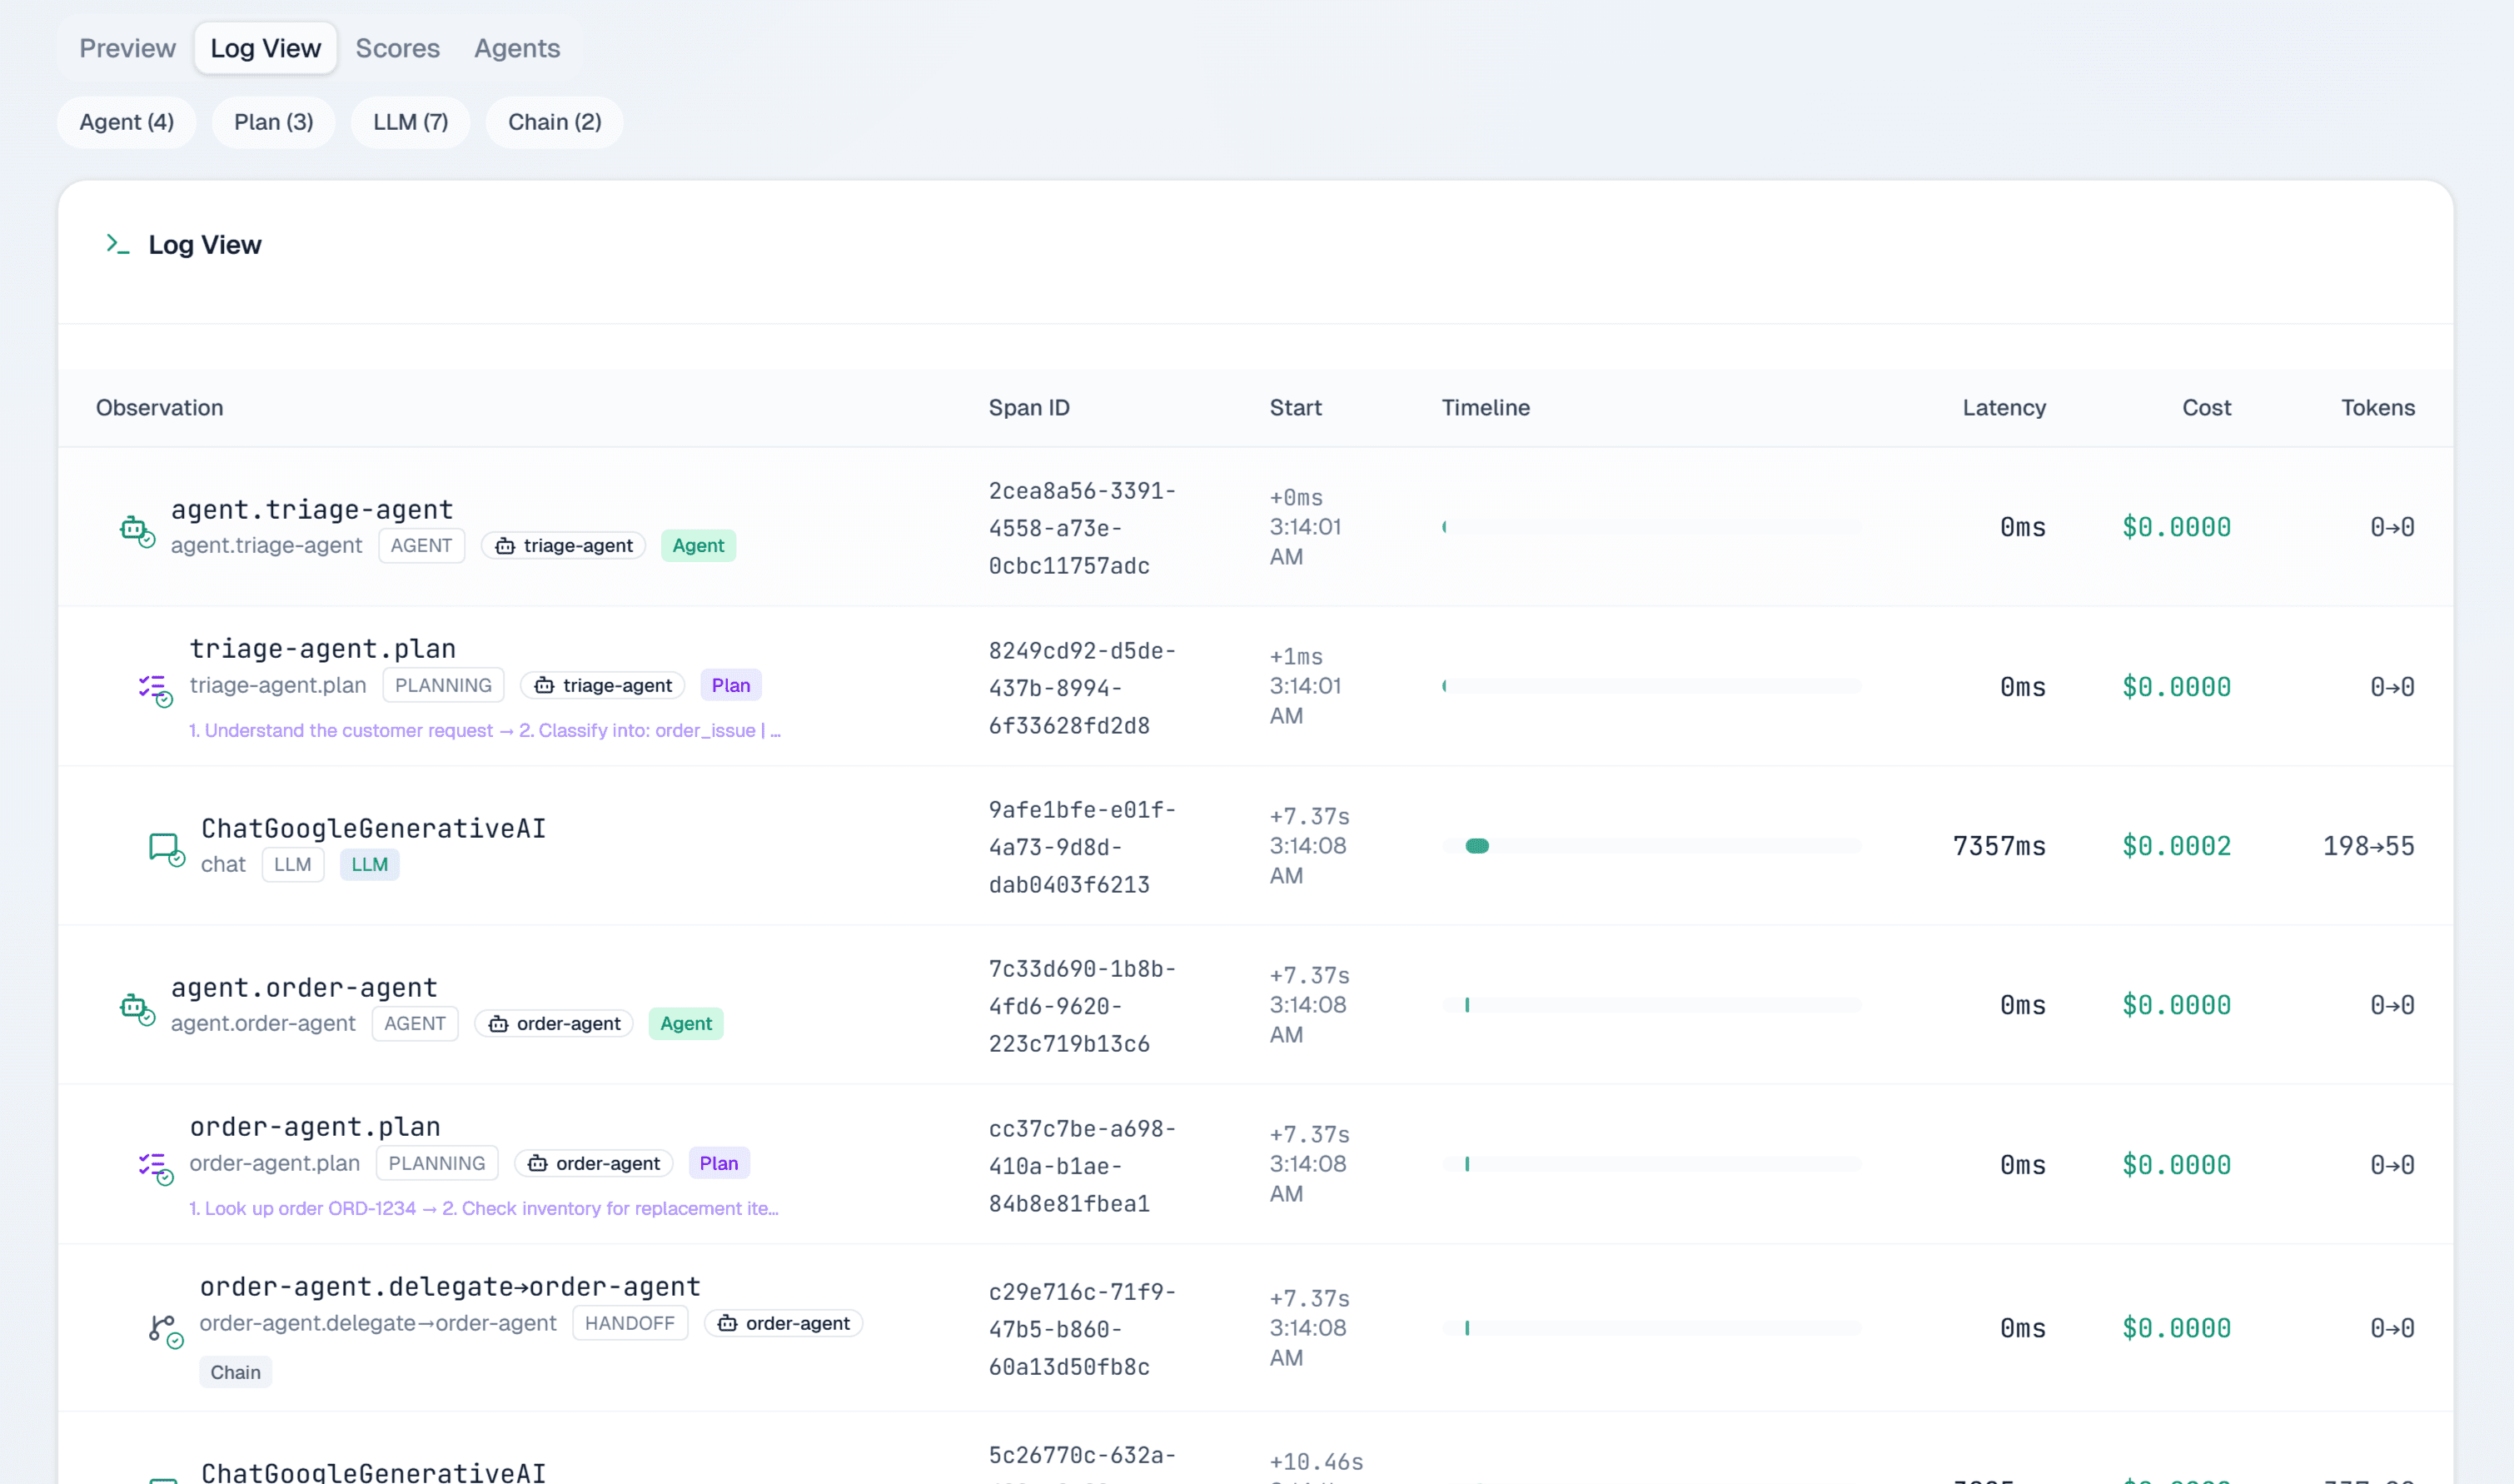
Visualize agent delegation as a flow graph
See the full decision chain: agent handoffs, tool calls, planning spans, rendered as an interactive flame graph. Click any span for exact cost, latency, and token breakdown.
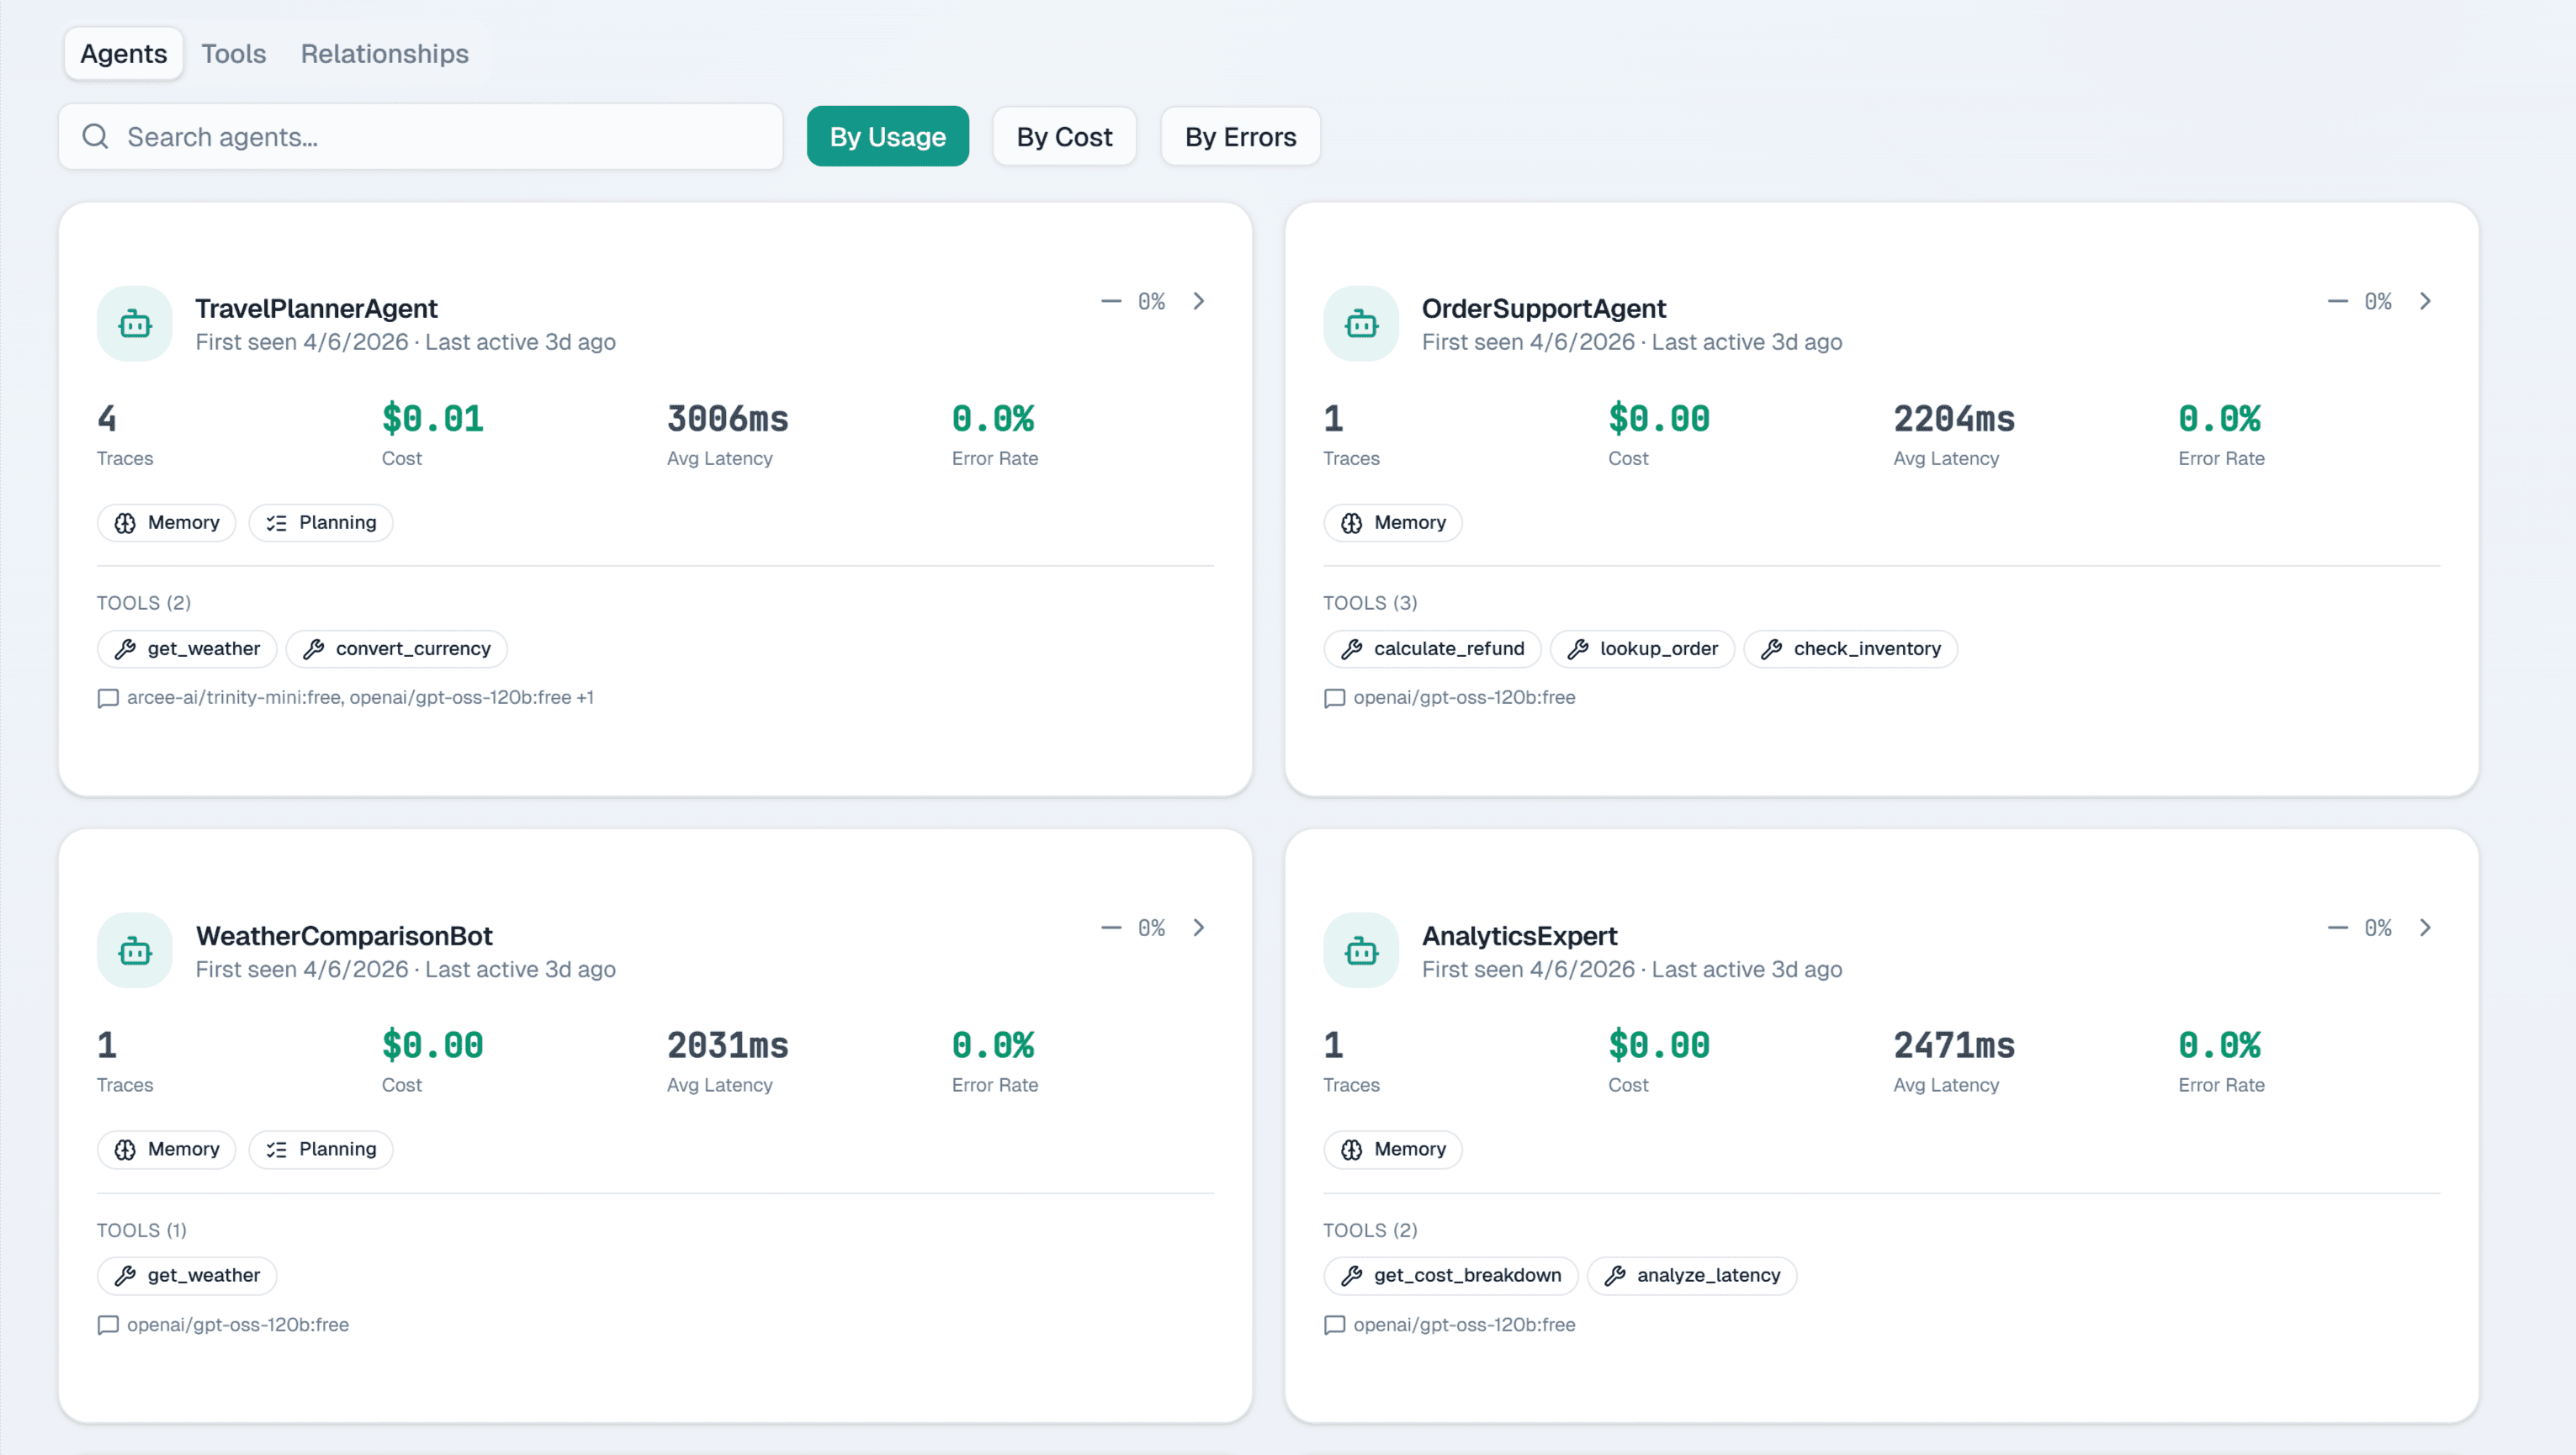
Every agent and tool, discovered automatically
Every agent that touches your SDK shows up in the registry on its first run: tools it uses, how often, and what it costs. Nothing to configure, nothing to register.
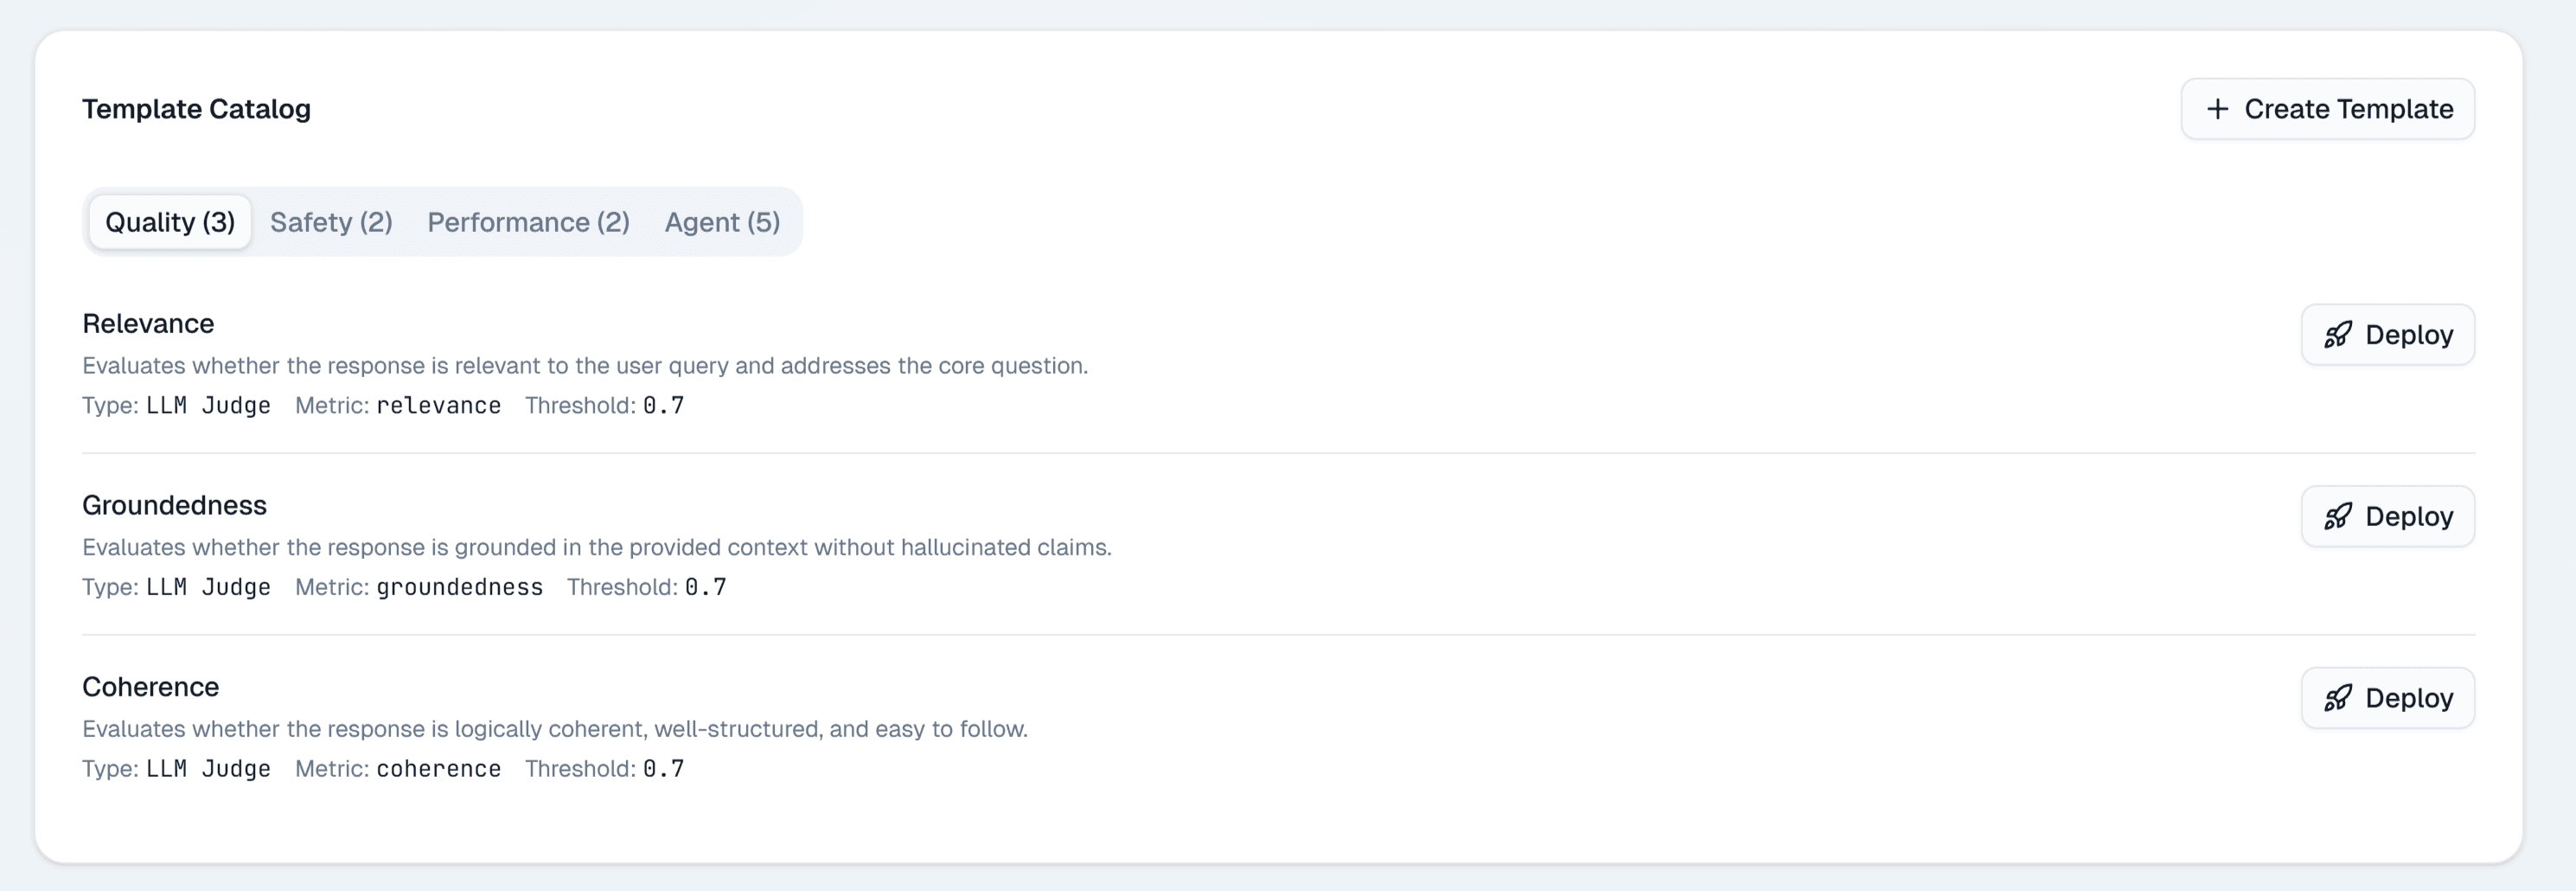
LLM-as-judge on every trace, zero setup
Twelve eval templates (faithfulness, toxicity, coherence, task completion, and more) run automatically on every new trace. When a prompt change ships, you'll know within minutes if it broke something.
Capabilities
Complete. Not retrofitted.
Setup
Under 5 minutes,
two lines of code.
One package, two runtimes
Python and TypeScript both supported. No forking, no vendor lock-in, no architecture changes required.
Use Cases
Built for every
AI team workflow.
One support bot or a hundred agents: the trace structure is the same.
LangChain & LangGraph
Trace every chain node, retrieval step, and prompt template with full token breakdown per hop.
CrewAI & AutoGen
Per-role cost and latency across every multi-agent delegation. See exactly which agent burned your budget.
Customer Support AI
SLA-aware error tracking, escalation pattern detection, and per-session quality scoring.
FinOps & Cost Control
Per-model spend attribution, overage alerts, and budget guardrails before a session goes rogue.
DevOps AI Pipelines
Deployment-correlated anomaly detection. Know within seconds if your last push broke agent behavior.
Eval & Regression
Auto LLM-as-judge scoring on every trace. Catch prompt regressions the moment a change ships.
Outcomes
Every AI decision,
traced and accountable.
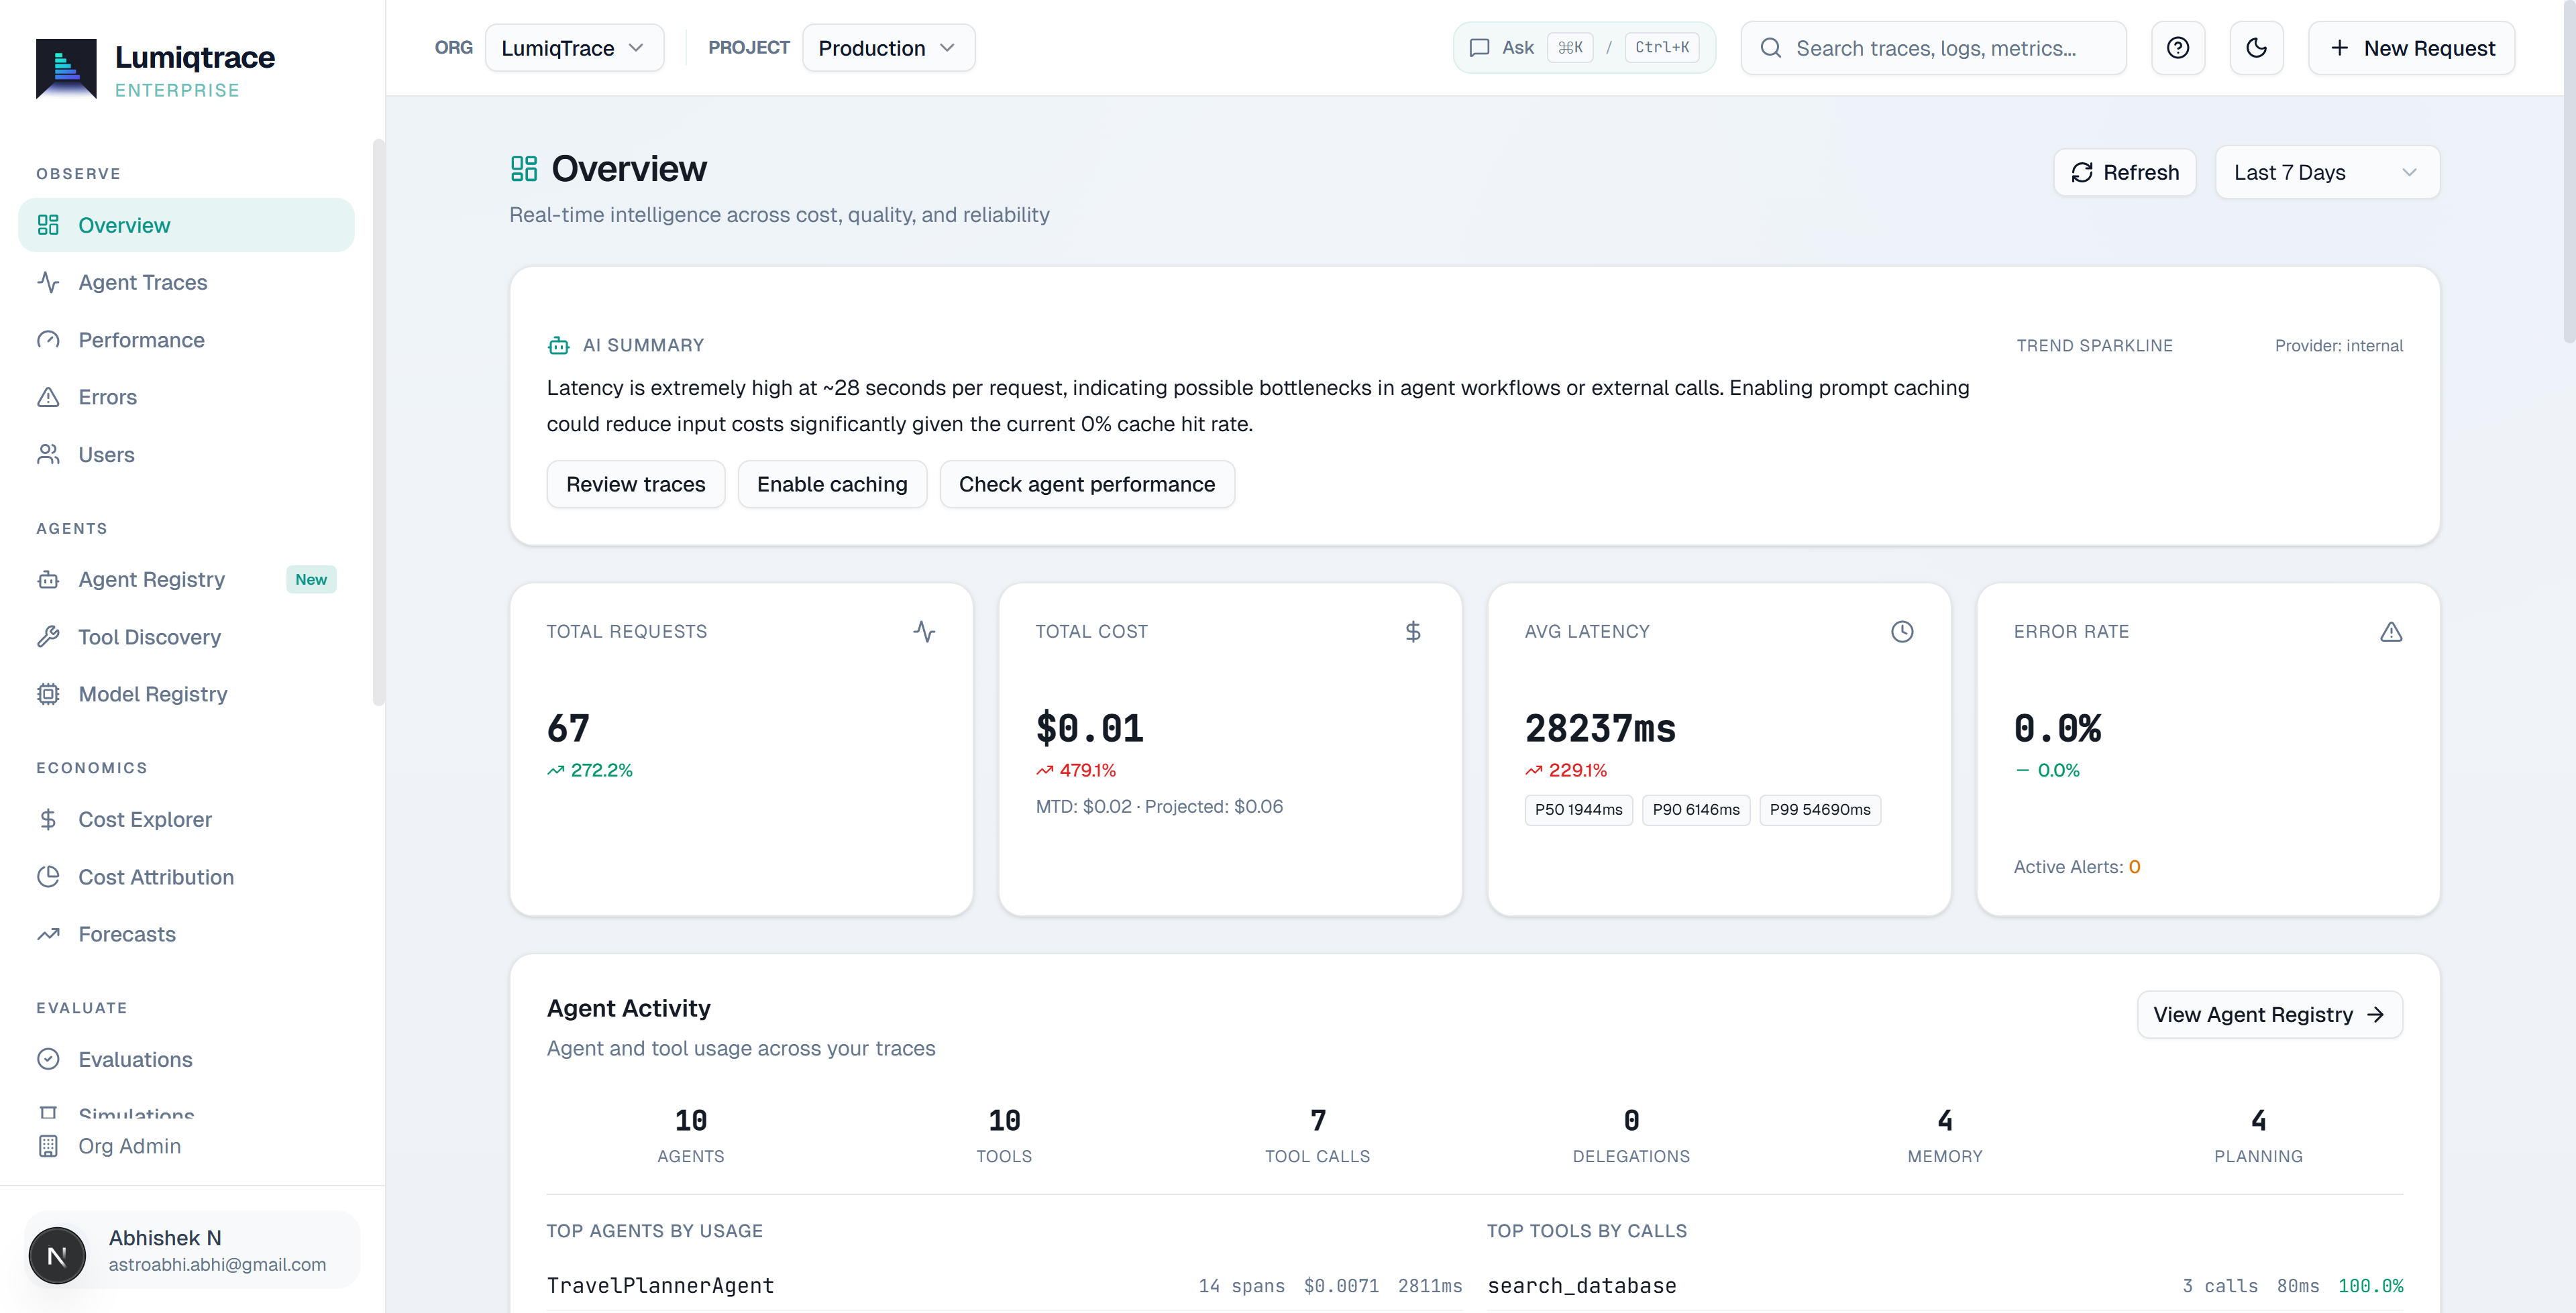
Everything that tells you if your agents are healthy: what they cost, where they fail, how long they take, and whether the output is any good. One dashboard, updating as runs happen.
Compare
Built for agent observability.
Not retrofitted.
| LumiqTrace | Helicone | LangSmith | Langfuse | |
|---|---|---|---|---|
| Setup time | 2 lines, <5 min | Minutes | Minutes | Minutes |
| Cost tracking | ||||
| Trace flame graph | Not available | |||
| Agent auto-discovery | Not available | Not available | Not available | |
| Multi-agent delegation | Not available | Limited | Limited | |
| AI Cost Optimizer | ✓ Exclusive | Not available | Not available | Not available |
| AI Anomaly Detection | ✓ Exclusive | Not available | Not available | Not available |
| Natural Language Query | ✓ Exclusive | Not available | Not available | Not available |
| Auto Root Cause Analysis | ✓ Exclusive | Not available | Not available | Not available |
| MCP server | ✓ Exclusive | Not available | Not available | Not available |
| Evaluation templates | 12 built-in | Not available | Custom only | Custom only |
| Free tier | 10K traces/mo | 10K/mo | Limited | Limited |
| Starting price | $39 / month | $20 | $39 | $29 |
MCP Server
Query your production data from Claude or Cursor.
LumiqTrace provides a hosted MCP server with 9 tools. Connect Claude Desktop, Cursor, or any MCP-compatible client and query traces, run root cause analysis, and ask natural language questions about your production data.
// claude_desktop_config.json
{
  "mcpServers": {
    "lumiqtrace": {
      "url": "https://api.lumiqtrace.com/v1/mcp",
      "headers": { "Authorization": "Bearer lqtp_..." }
    }
  }
}Pricing
Transparent pricing.
Start free. Scale as your agents grow.
Free
Start tracing your agents instantly. 10,000 traces a month with zero commitment.
Get started with
- 14-day retention
- 2 projects · 1 seat
- Trace ingestion (SDK + OTel)
- Cost attribution per trace
- Manual evaluations
- Pre-built guardrail rules
Solo
For individual developers shipping production agents. 100K traces a month included.
Everything in Free
- 30-day retention
- 10 projects · 1 seat
- LLM-as-judge auto-eval
- Custom eval criteria
- Prompt versioning + playground
- Slack / webhook notifications
Pro
Full platform for teams shipping agents at scale. 500K traces a month with overage.
Everything in Solo
- 90-day retention
- Unlimited projects · 10 seats
- LumiqPilot (200 queries/mo)
- Custom guardrails + enforcement
- Bulk eval runs + history
- A/B prompt testing + AI optimization
- Simulations + anomaly detection
- AI incident correlation
Team
Advanced controls for growing engineering teams. 2M traces a month with SSO and SLA.
Everything in Pro
- 180-day retention
- Unlimited projects · 15 seats
- LumiqPilot (1,000 queries/mo)
- Scheduled simulations
- SSO (SAML/OIDC)
- PagerDuty integration
Scale
Custom pricing for large teams. 10M+ traces, self-hosted option, dedicated SLA, and unlimited seats.
- 10M+ traces / month
- Unlimited seats
- LumiqPilot unlimited
- BYOK (Bring Your Own Keys)
- Self-hosted deployment option
- 365-day retention
- Dedicated SLA + support
- Custom integrations
Pricing Calculator
Estimate your monthly cost
| Item | Details | Cost |
|---|---|---|
| Base plan | Pro | $149.00 |
| Included traces | 500,000 of 500,000 used | $0.00 |
| Trace overage | None (within included limit) | — |
| Included seats | 3 of 10 used | $0.00 |
| Extra seats | None (7 seats still available) | — |
| Total | $149/mo | |
Your agents are running.
Do you know what they're doing?
Join the waitlist. Be first to know when we launch.
FAQ